Organizations rely heavily on business intelligence (BI) to gain valuable insights, make informed decisions, and drive overall success. However, diving into the world of BI can be daunting, especially for newcomers unfamiliar with the field’s terminology and concepts. This blog post aims to demystify BI by breaking down seven fundamental terms everyone should know.
Retail business Intelligence encompasses a range of activities, including data collection, analysis, and interpretation, to transform raw data into actionable insights. Understanding the key concepts and processes helps you navigate this complex field effectively. Understanding the following fundamental terms gives you the necessary knowledge to delve deeper into retail business intelligence.
1. Data Silo
A data silo is a standalone data source not connected to a centralized data repository. Businesses generate vast amounts of data from various activities and departments, often in separate systems or locations. For example, a business might store sales data in one system, marketing data in another, and customer data in another. These data silos hinder data accessibility and integration, making it challenging to derive meaningful insights from the dispersed information.
By combining data from different silos, BI enables organizations to comprehensively view their operations, customers, and market trends. This unified data approach facilitates the discovery of valuable patterns, correlations, and insights that would otherwise remain hidden within individual silos. Retail business intelligence empowers businesses to make data-driven decisions, optimize processes, and gain a competitive edge.
2. Data Warehouse
A data warehouse plays a crucial role in retail business intelligence by serving as a specialized database that acts as a central repository for data extracted from different sources or silos. It is a foundation for data analysis and reporting, providing a unified and consistent view of the organization’s information.
Data warehouses consolidate data from various operational systems, including transactional databases, spreadsheets, and external sources, into a single, integrated structure. By leveraging historical data, organizations can gain insights into long-term trends, customer behavior, and market dynamics, enabling them to make data-driven decisions. Data quality and consistency are crucial for accurate analysis in retail business intelligence, and data warehouses provide mechanisms to clean and transform the data during the extraction and loading processes.
3. ETL (Extract, Transform, Load)
Extract
ETL (Extract, Transform, Load) is a crucial process in retail business intelligence (BI) involving three essential tasks ETL tools perform. First, the Extract phase entails retrieving data from various sources, including databases, spreadsheets, APIs, or external systems. The goal is to gather the data required for analysis and reporting.
Transform
Once you extract the data, the Transform phase comes into play. This step involves applying necessary data transformations and standardizations to ensure consistency and compatibility. Transformations may include data cleansing, normalization, aggregation, or calculation of derived metrics. The objective is to prepare the data in a format suitable for analysis and to align it with the desired data model.
Load
The transformed data is ready for the Load phase. During this phase, the transformed data moves into its target destination, often a data warehouse, although it can also be a data mart or a reporting database. The loading process involves organizing the data in a structured manner, adhering to the schema of the target destination. It allows for efficient data storage, indexing, and retrieval for retail business intelligence purposes.
4. RDBMS (Relational Database Management System)
RDBMS (Relational Database Management System) is software for administering and managing relational databases. Commonly known examples of RDBMS include MySQL, SQL Server, and PostgreSQL. In retail business intelligence (BI), one builds data warehouses typically using relational databases, making an RDBMS essential for managing and querying the data within the warehouse.
The relational structure of databases allows for efficient data retrieval and analysis. Queries can be performed using SQL (Structured Query Language) to extract specific data, perform aggregations, join tables, and apply various filtering criteria. RDBMS also offers data integrity, security, concurrency control, and transaction management features. These capabilities ensure data remains consistent, accurate, and protected in multi-user environments.
5. SQL (Structured Query Language)
SQL, often called “sequel,” stands for Structured Query Language. It is a standardized language used to communicate with relational databases or RDBMS. SQL plays a vital role in querying databases to extract the required information for analysis. It allows users to retrieve specific data, perform aggregations, filter data based on particular conditions, and join multiple tables.
Retail business intelligence tools commonly leverage SQL query engines to execute these tasks seamlessly.
While there may be slight variations in syntax across different RDBMS, the core concepts and functionality of SQL remain consistent. A solid understanding of SQL is essential for working with data in retail business intelligence. It empowers users to access and manipulate data in relational databases, enabling them to generate meaningful reports, dashboards, and visualizations that drive informed decision-making.
6. KPI (Key Performance Indicator)
KPI stands for Key Performance Indicator. KPIs are metrics or values that businesses utilize to measure their performance and gauge their progress in achieving objectives. KPIs can be broad, assessing overall company performance, or specific, focusing on marketing, finance, sales, or website traffic. Defining and tracking relevant KPIs is crucial for gaining insights into retail business intelligence and making data-driven decisions.
By establishing clear and measurable KPIs, organizations can set benchmarks, monitor progress, and identify areas for improvement. KPIs serve as performance targets and help align business activities with strategic goals. They enable stakeholders to access real-time data and stay informed about key metrics that drive organizational success.
7. Dashboard
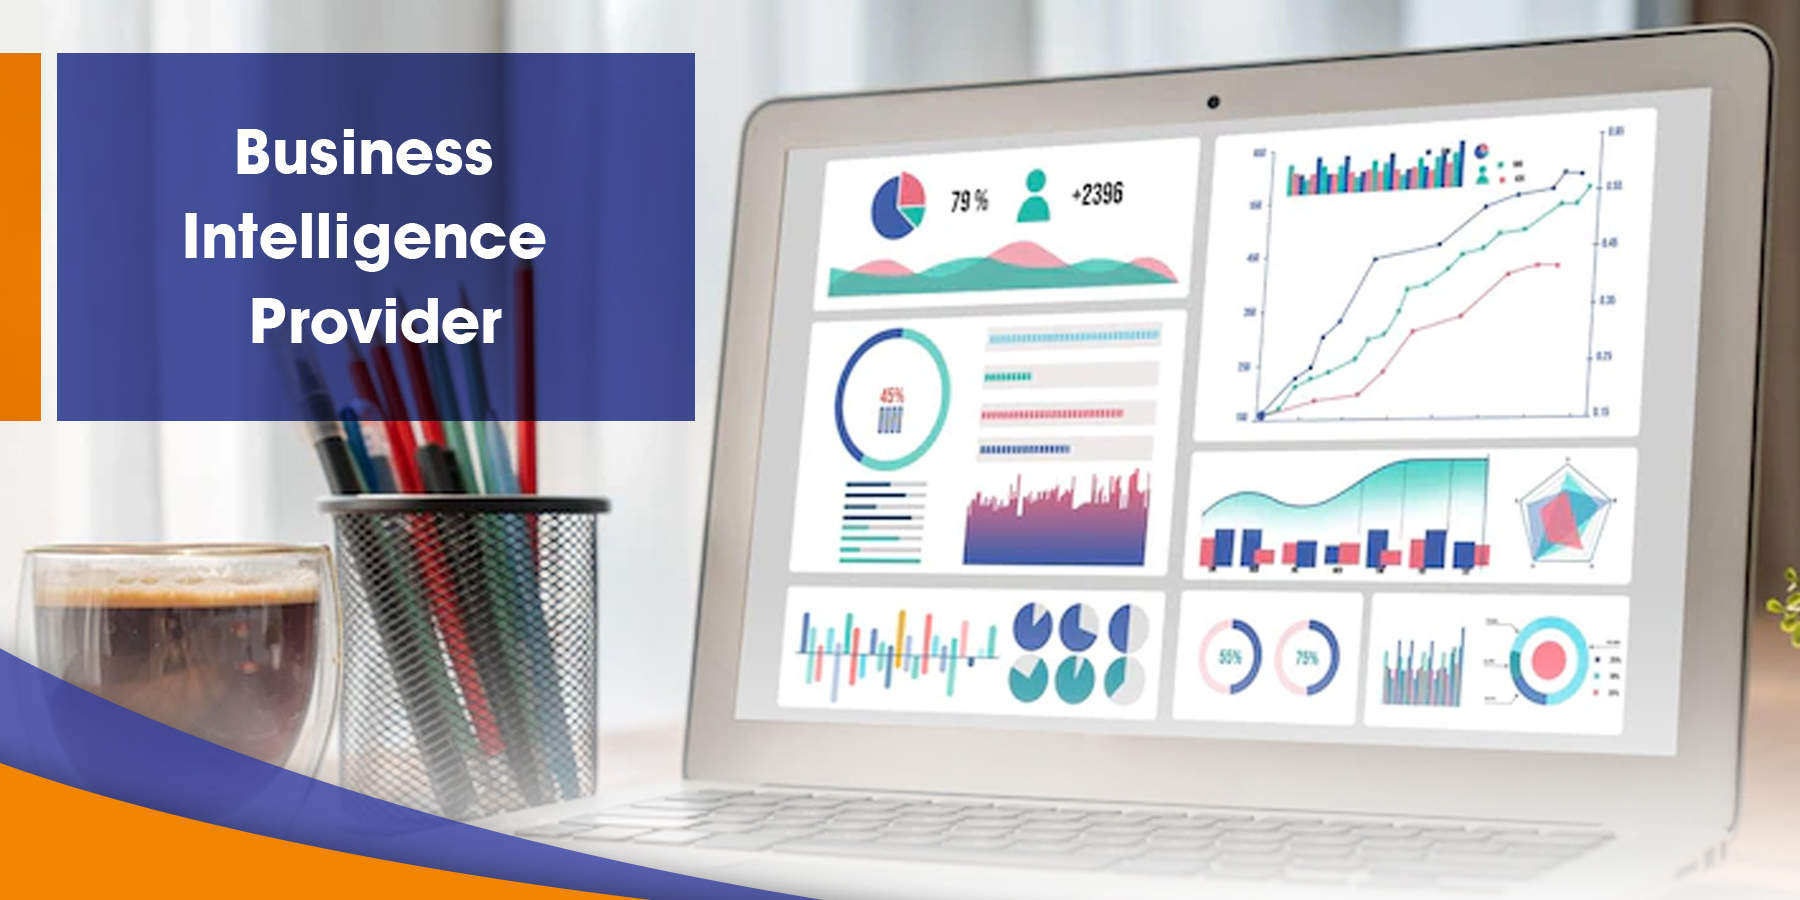
Dashboards culminate in the retail business intelligence (BI) process, presenting a visual representation of key metrics and aggregated data in a user-friendly and easily digestible format. Unlike traditional narrative reports, dashboards provide an at-a-glance snapshot of a business’s performance, allowing users to assess the current state of affairs quickly.
These interactive dashboards are often connected to live data sources, providing real-time updates as new data is generated or modified. A BI dashboard showcases critical business metrics such as revenue, stock levels, customer satisfaction, and social media engagement. Users can customize their dashboards to focus on specific metrics or areas of interest, allowing for personalized insights and targeted analysis.
Conclusion
Acquiring a basic understanding of the seven essential terms in retail business intelligence (BI) – data silos, data warehouses, ETL processes, RDBMS, SQL, KPIs, and dashboards – sets a solid foundation for navigating the complex world of BI. Familiarizing yourself with these concepts enables you to effectively integrate and harness data from diverse sources, analyze it in centralized repositories, and ensure data integrity and compatibility through ETL processes.
For assistance with retail business intelligence, consider reaching out to Vserve. They provide tailored solutions and expertise to help businesses leverage data effectively for retail success.
This blog is inspired by the video, ‘7 Business Intelligence Terms Everyone Should Know | BI For Beginners’ by ‘Adam Finer – Learn BI Online.’


